Under-appreciated stat from last week’s election:
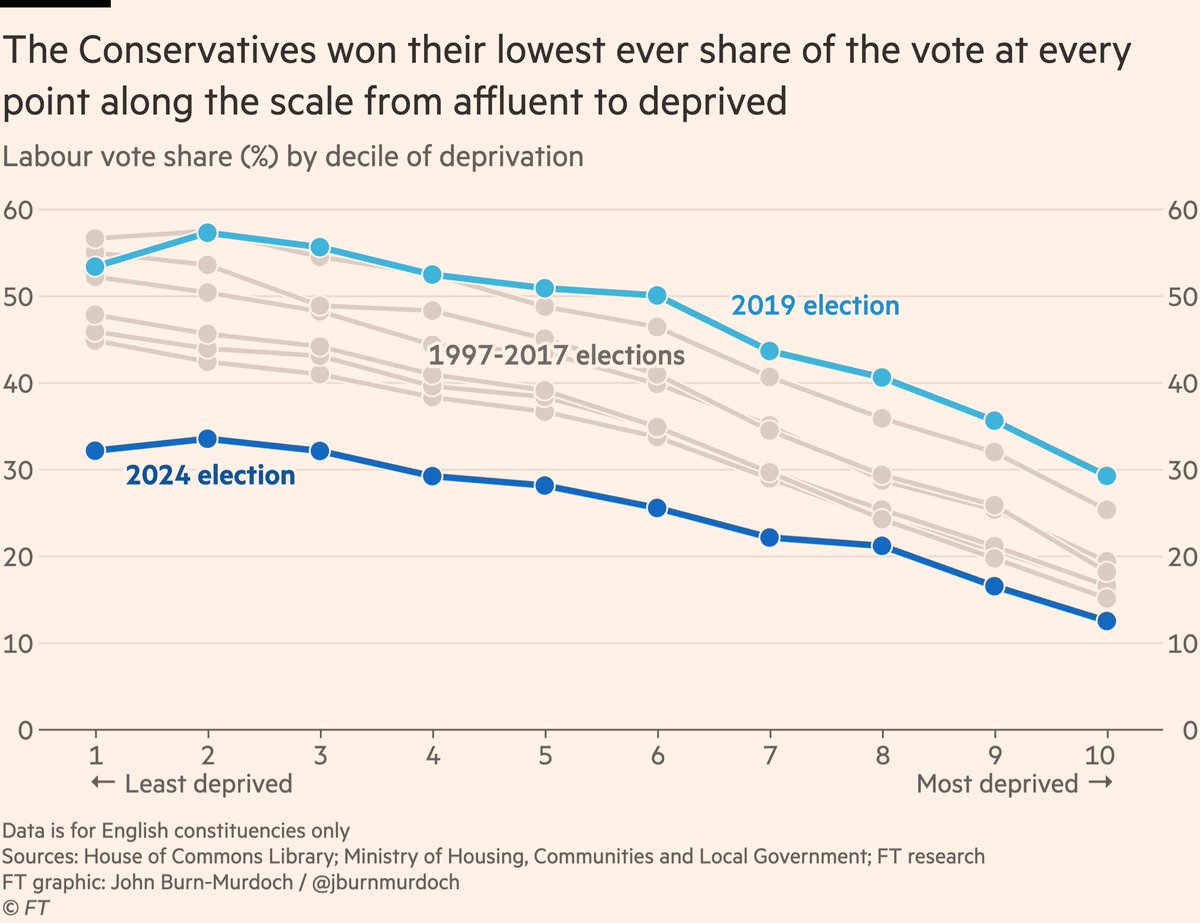
Labour won its lowest ever share of the vote in deprived areas (<50% for the first time), and its highest ever share in affluent areas.
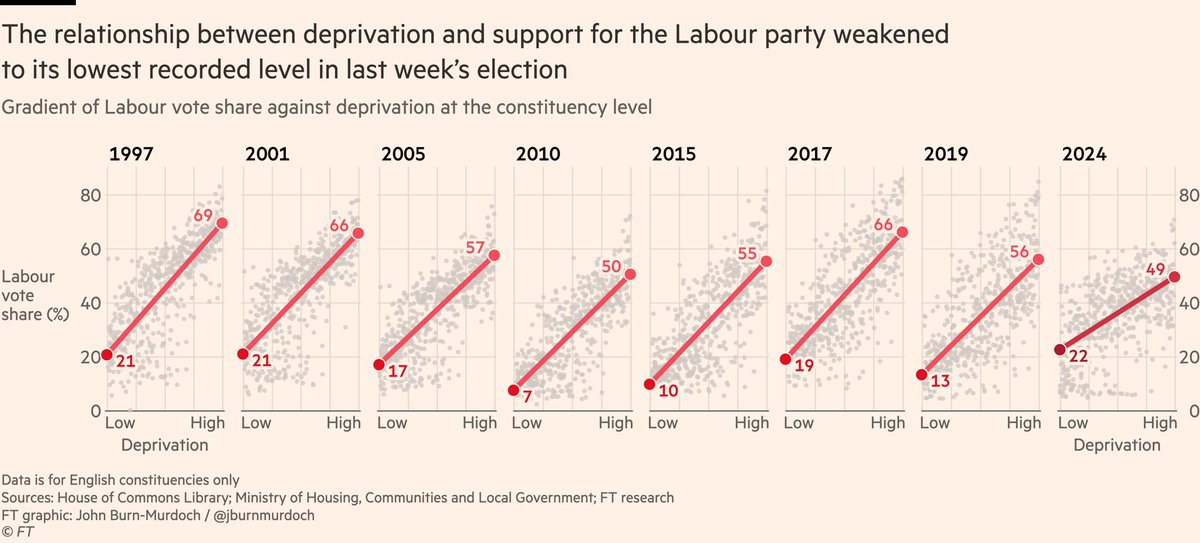
The result is a dramatic flattening of the class gradient in Labour support.
Here’s the same thing laid out as a timeline so you can see specific elections.
Interesting how Blair 1997 and Corbyn 2017 had similarly steep class gradients.
And shows how Starmer’s landslide was quite different to Blair’s.
This is all another side-effect of the hyper-efficient distribution of the Labour vote last week.
Very large margins in safe seats (many in very deprived areas) were squeezed, while gains in more affluent areas won seats from the Tories.
And here is the same deprivation vs vote share chart for the Conservatives, as requested by @cjayanetti.
A collapse right across the board, and only won 32% of the vote even in the most affluent parts of the country.
Under-appreciated stat from last week’s election:
Labour won its lowest ever share of the vote in deprived areas (<50% for the first time), and its highest ever share in affluent areas.
The result is a dramatic flattening of the class gradient in Labour support. Here’s the same thing laid out as a timeline so you can see specific elections.
Interesting how Blair 1997 and Corbyn 2017 had similarly steep class gradients.
And shows how Starmer’s landslide was quite different to Blair’s. This is all another side-effect of the hyper-efficient distribution of the Labour vote last week.
Very large margins in safe seats (many in very deprived areas) were squeezed, while gains in more affluent areas won seats from the Tories.And here is the same deprivation vs vote share chart for the Conservatives, as requested by @cjayanetti.
A collapse right across the board, and only won 32% of the vote even in the most affluent parts of the country.
yes