

How bad are Richard Lynn's 2002 national IQ estimates? They correlate at r = 0.93 with our current best estimates. It turns out that they're really not bad, and they don't provide evidence of systematic bias on his part🧵
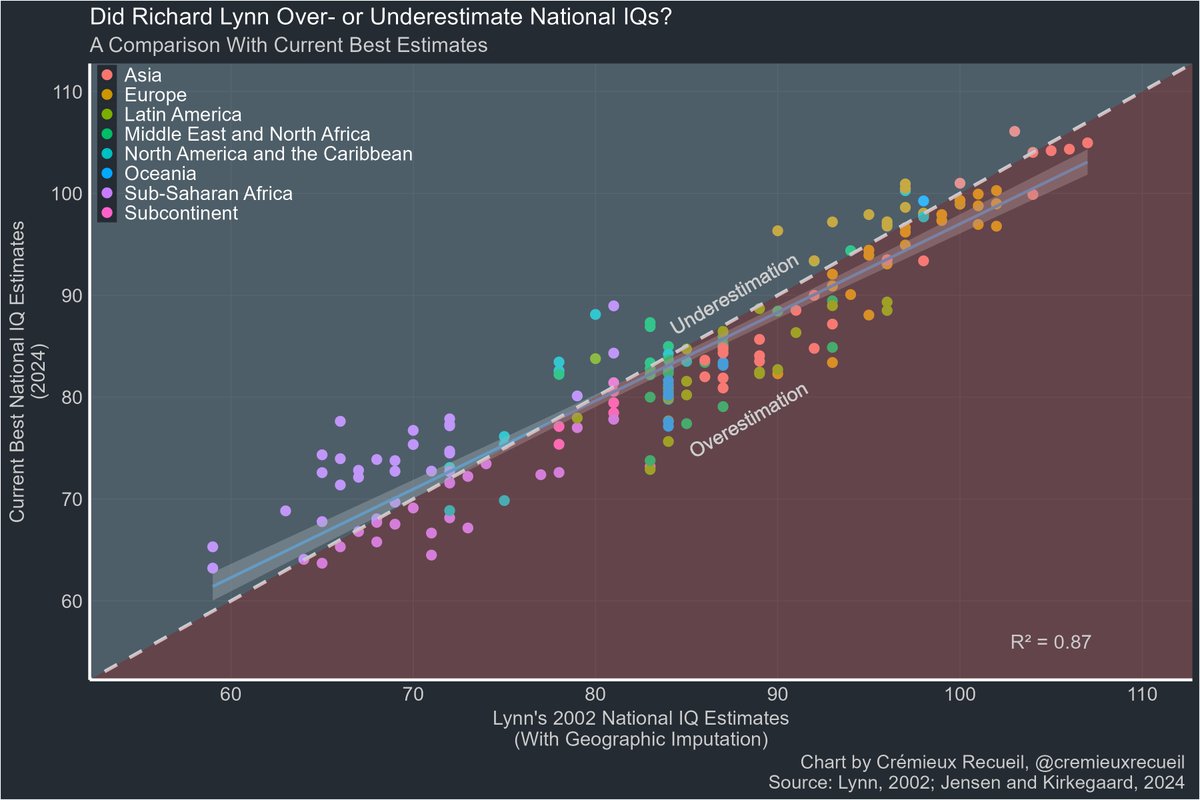
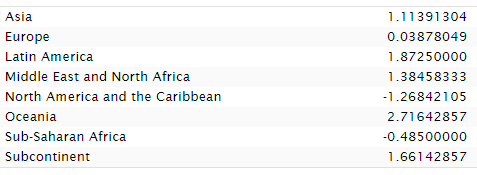
In this data, Lynn overestimated national IQs relative to the current best estimates by an average of 0.97 points. The biggest overestimation took place in Latin America, where IQs were overestimated by an average of 4.2 points. Sub-Saharan Africa was underestimated by 1.89 pts.
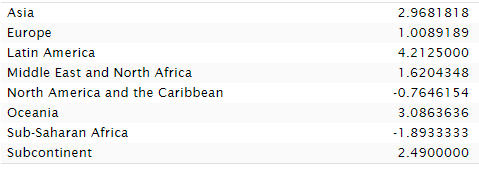
Bias? If you look at the plot again, you'll see that I used Lynn's infamously geographically imputed estimates. That's true! I wanted completeness. What do the non-imputed estimates look like? Similar, but Africa does worse. Lynn's imputation helped Sub-Saharan Africa!
If Lynn was biased, then his bias had minimal effect, and his much-disdained imputation resulted in underperforming Sub-Saharan Africa doing a bit better. Asia also got a boost from imputation. The evidence that Lynn was systematically biased in favor of Europeans? Not here.
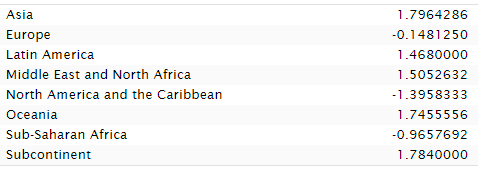
Fast forward to 2012 and Lynn had new estimates that are vastly more consistent with modern ones. In fact, they correlate at 0.96 with 2024's best estimates.
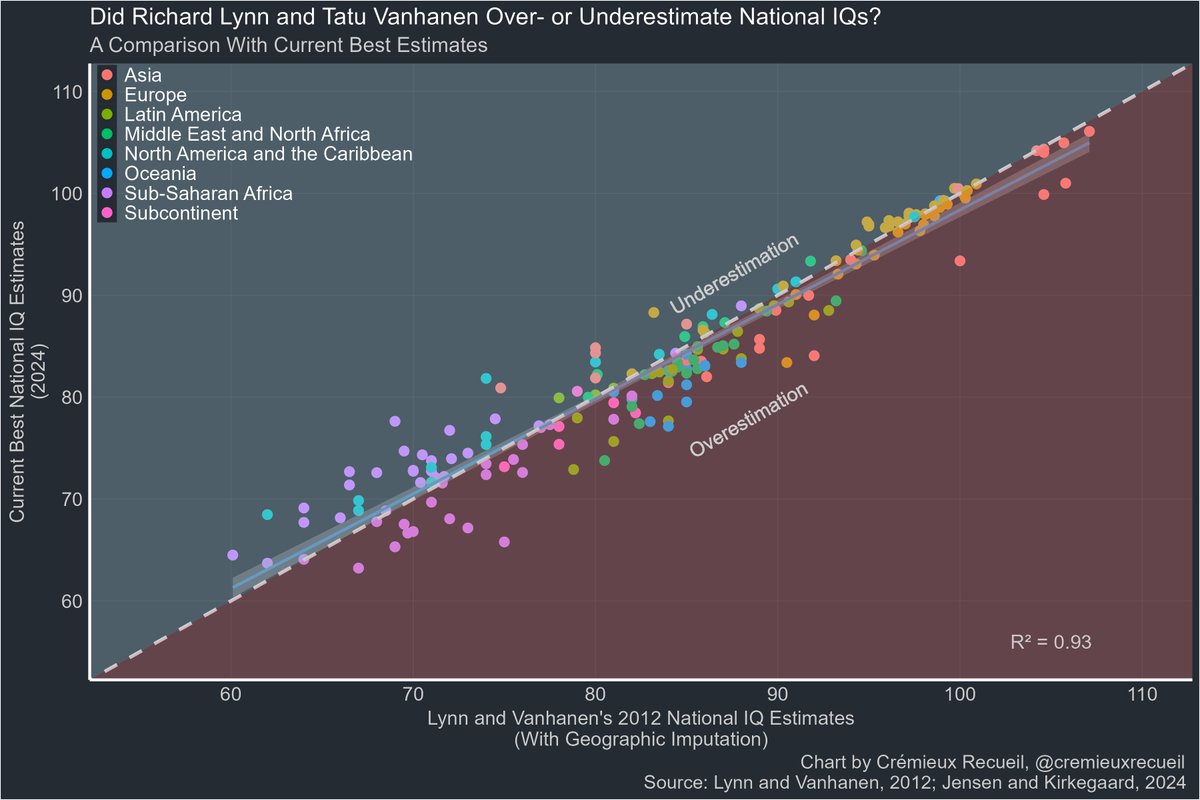
With geographic imputation, the 2012 data minimally underestimates Sub-Saharan Africa and once again, whatever bias there is, is larger with respect to Latin America, overestimating it. But across all regions, there's just very little average misestimation.
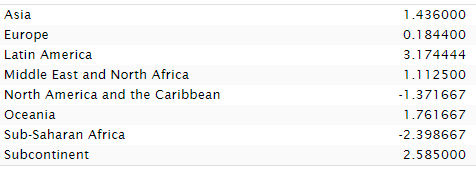
Undo the imputation and, once again... we see that Lynn's preferred methods improved the standing of Sub-Saharan Africans. There's really just nothing here. Aggregately, Lynn overestimated national IQs by 0.41 points without imputation and 0.51 with. Not much to worry about.
The plain fact is that whatever bias Lynn might have had didn't impact his results much. Rank orders and exact estimates are highly stable across sources and time. Want to learn more? See:
If you would actually like to learn about this subject, here are some links.
— Crémieux (@cremieuxrecueil) June 21, 2024
On the validity of national IQs: https://t.co/D5nxqnEpp6
See this too, and note that it depicts rank correlations:
Neat: scores from these sources for 'First World', 'Second World', 'Third World', China, U.K., U.S., Russia, Brazil, Indonesia, Egypt, South Africa, and each dataset's mean are basically perfectly intercorrelated. https://t.co/7r8t3c7bHC pic.twitter.com/UR2EcQhdQN
— Crémieux (@cremieuxrecueil) May 22, 2024
See this as well, on how very diverse data produces the same results:
Because less intelligent people give more extreme responses, you can measure national IQs using personality or even parental advice to kids' questionnaires. A lot of methods work and deliver extremely high (>0.80) correlations with measured NIQs.https://t.co/afje5afIgI
— Crémieux (@cremieuxrecueil) May 18, 2023
And finally, see for the source of our current best estimates.